Contents
- Hour 1: What is SSRS and determine whether it is installed
- Hour 2: Report using wizard
- Hour 3: First SSRS report
- Hour 4: Report with parameter
- Hour 5: Custom template
- Hour 6: Drill down report
- Hour 7: Sub report
- Hour 8: Report with style
- Hour 9: Report with chart
- Hour 10: Report deployment
- Hour 11: RDL file to ASP.Net
SSRS Report with Chart
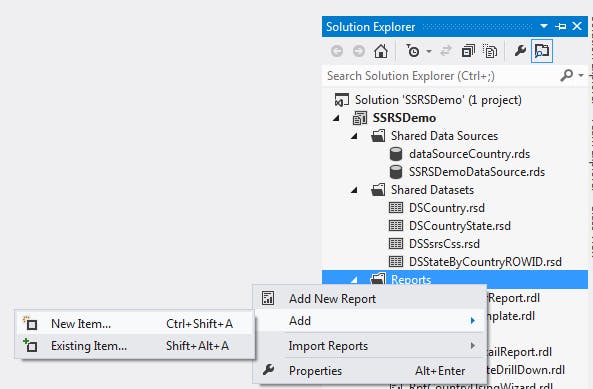
- Step 1: To add the report, right-click on "Reports", select "Add" and click on "New Item".
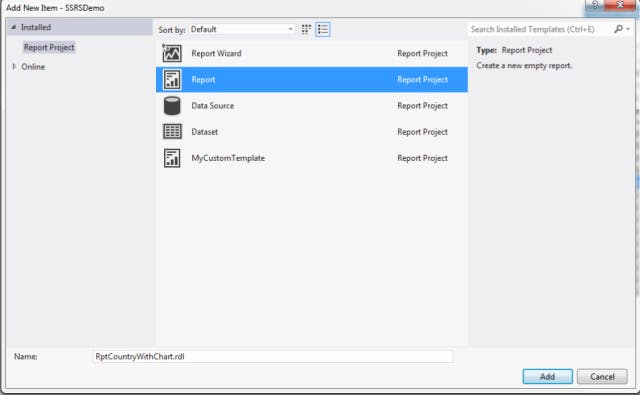
- Step 2: Select "Report" and provide the report name.
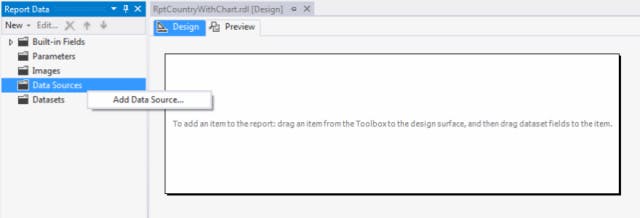
- Step 3: Add a data source to the report data, right-click on "Data Sources" and click on "Add Data Source".
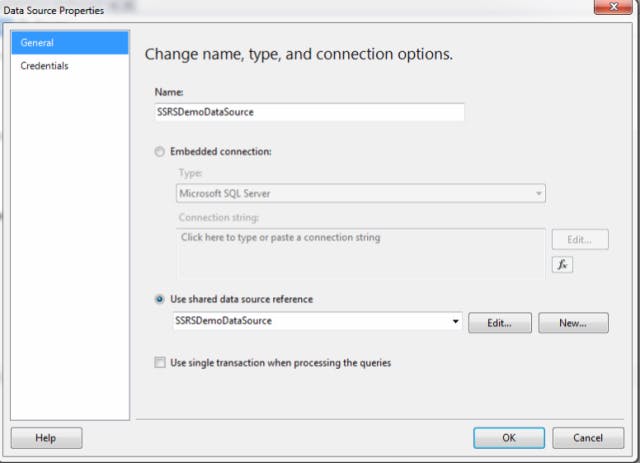
- Step 4: Provide a data source name and select shared data source reference.
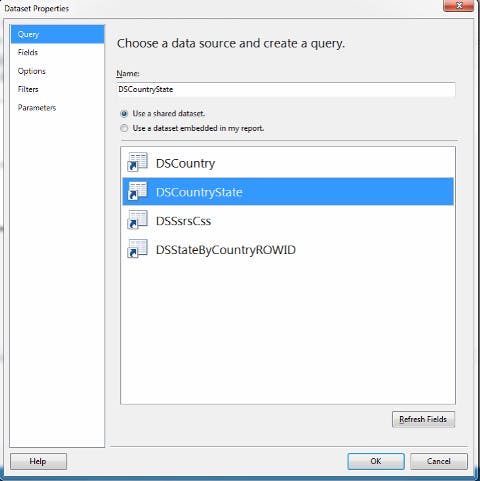
- Step 5: Add a dataset in the report data, right-click on "Datasets" and click on "Add Dataset".

- Step 6: Provide a dataset name and select shared dataset.
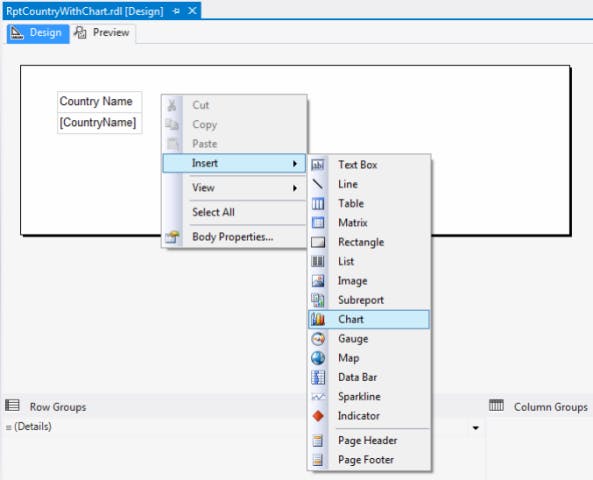
- Step 7: Right-click on the design surface, select "Insert" and click on "Chart".
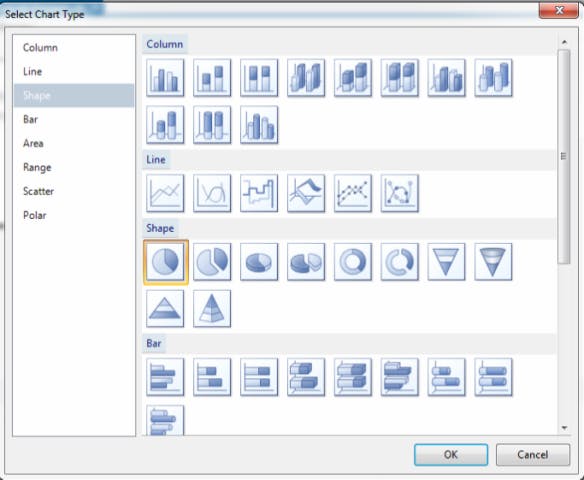
- Step 8: Select any one chart type from the list, for example column, Line, Shape, Bar and so on.
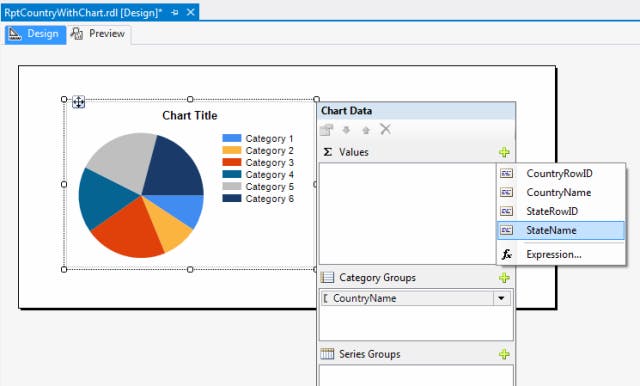
- Step 9: Select and click on the chart area and we will have a chart data. Go to Category Groups and click on the "+" symbol, it shows all the fields and Select "CountryName" as the group category.
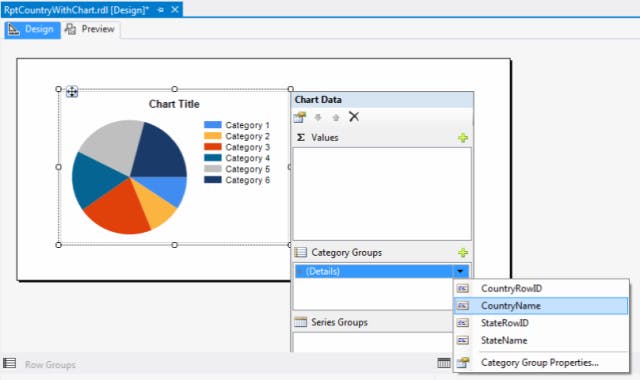
- Step 10: In the preceding the Category Groups have Values, in that click on the "+" symbol and again we will have all the fields and Select "StateName" as values.
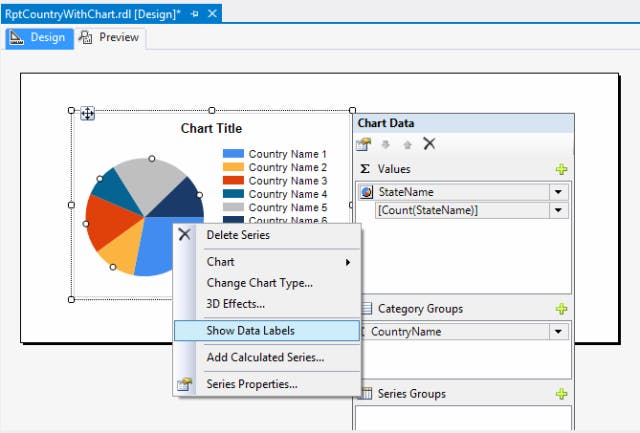
- Step 11: Click on the Black down arrow attached with StateName and select "Show Data Labels".
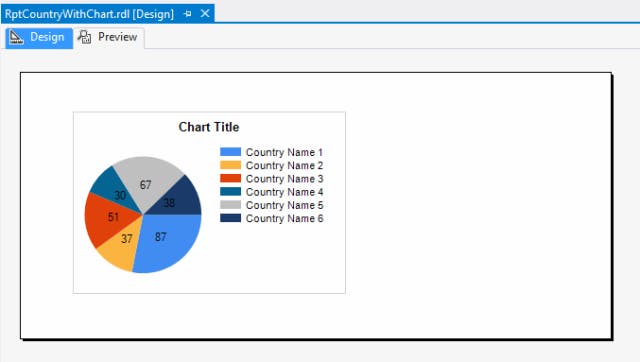
- Step 12: Now our report design is ready.
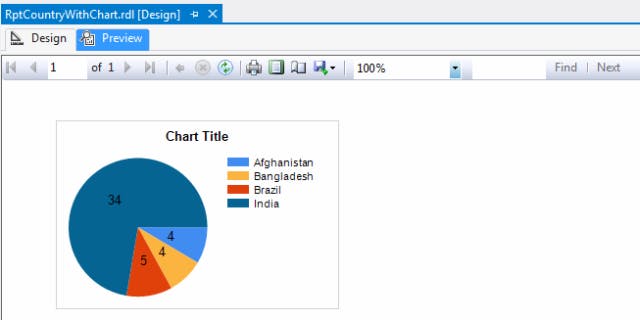
- Step 13: Click on the "Preview" tab and the chart is displayed with the country and the number of states.
Next >> Hour 10: Report deployment

